Customizable dashboard
Arrange graphs, status, and recent activity however you like. Colors and formatting react when things change, so what needs attention stands out.
Designed to be light weight, for personal or small-team setups. Watch your services, catch webhooks, poll rates or APIs, and see what matters on a drag-and-drop dashboard — without standing up a full monitoring stack.
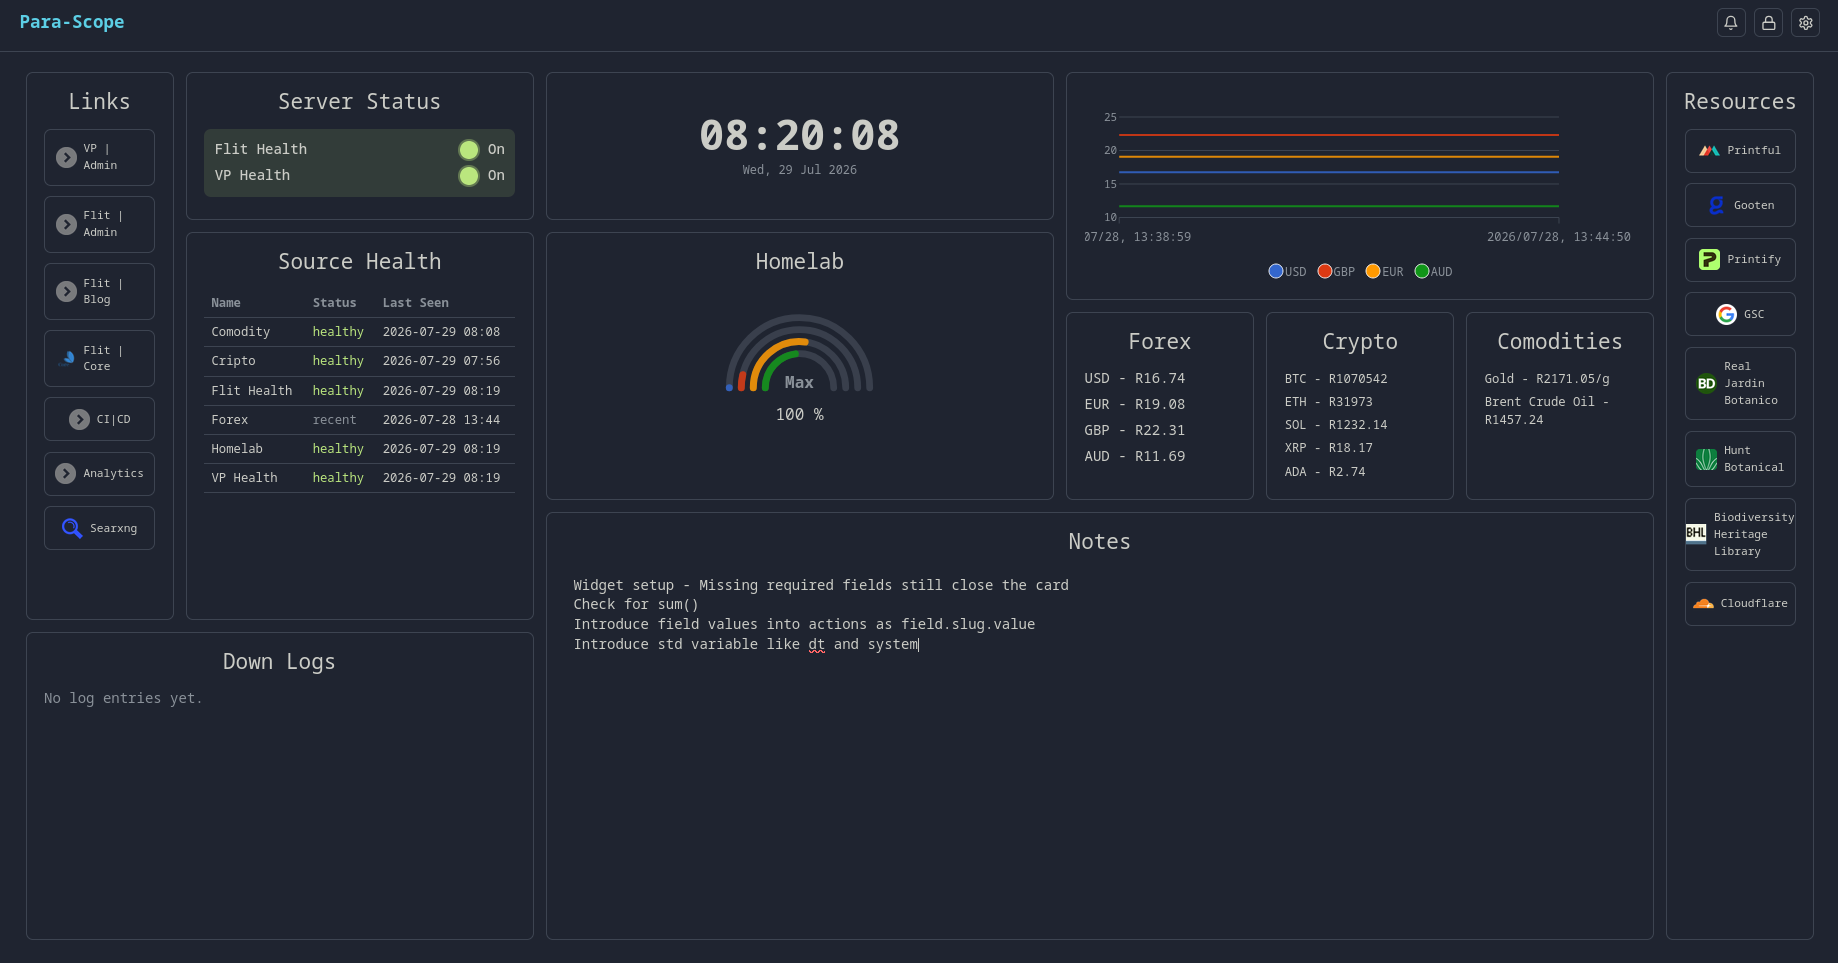
Arrange graphs, status, and recent activity however you like. Colors and formatting react when things change, so what needs attention stands out.
Pull events in via webhooks or scheduled polls — from APIs, payment gateways, or your own endpoints — and keep time and status in one place.
Keep named values and logs across the board for graphs and status indicators, without babysitting a separate database.
When something matches, update a field, ping an endpoint, or notify you — in the order you set.
para-scope is a lightweight way to monitor services, aggregate data from outside sources, and react to events — without the overhead of a full monitoring stack. It runs as a single FastAPI process with SQLite, and no Docker is required. It is not meant to replace Prometheus/Grafana or a workflow engine like n8n.